Overview
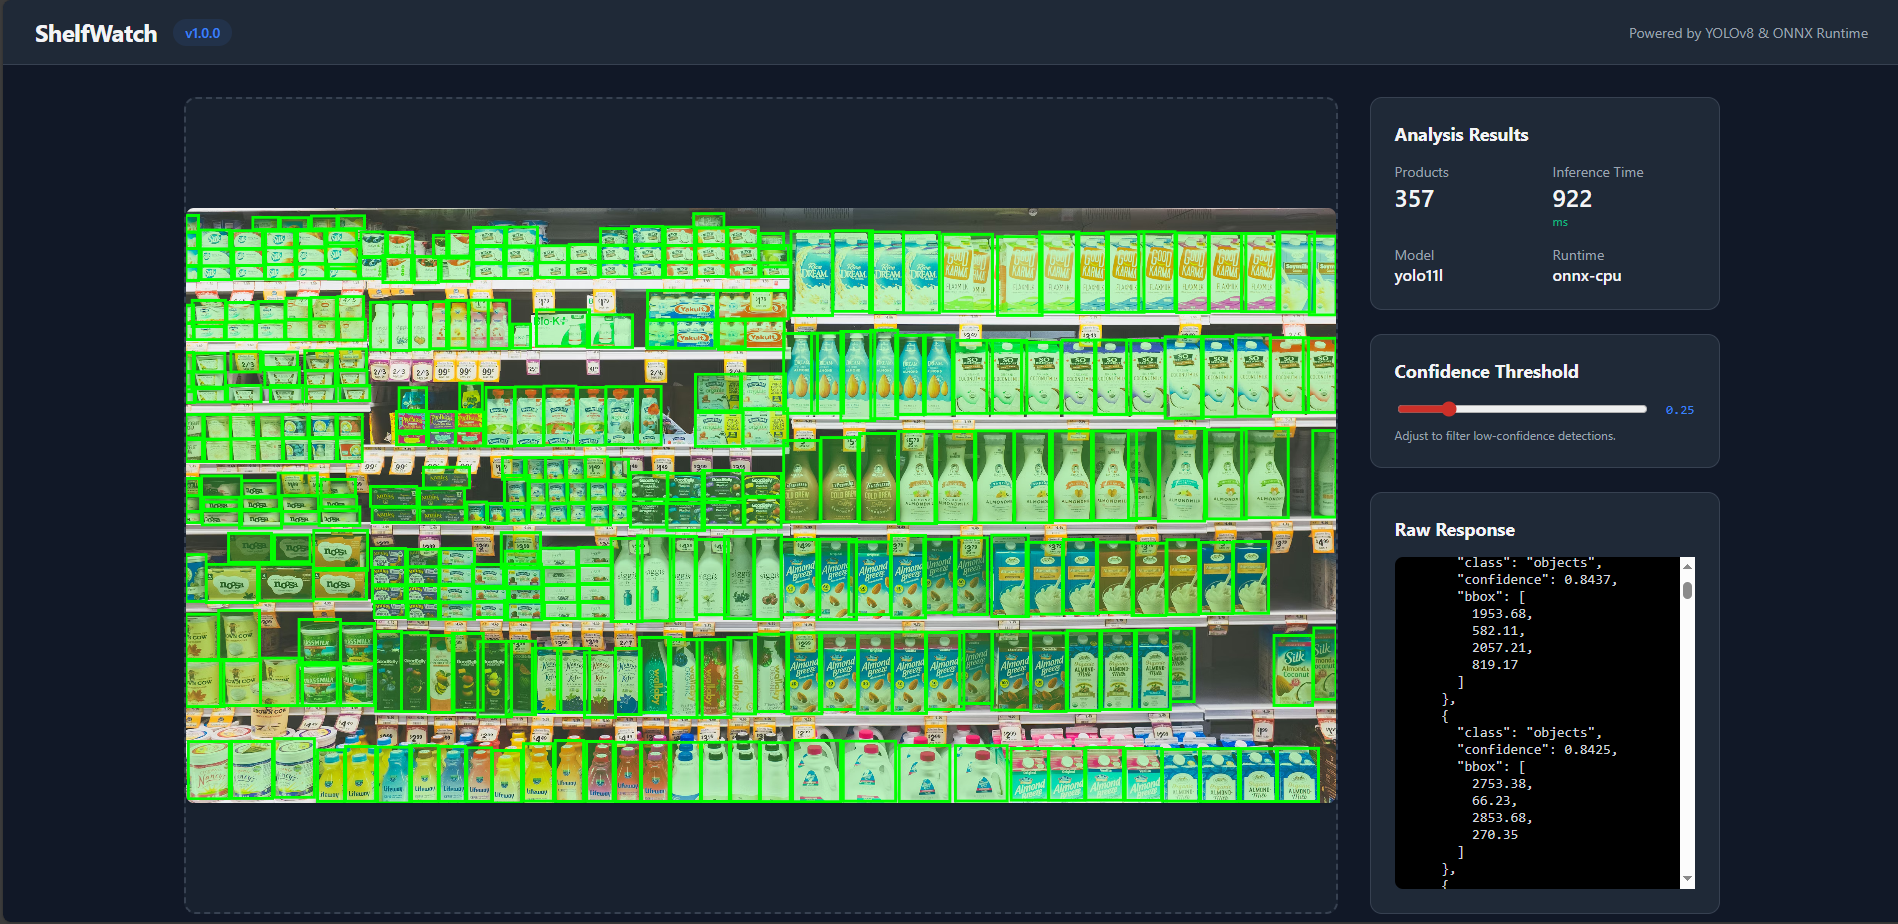
ShelfWatch is an automated stock auditing platform that utilizes a fine-tuned YOLO11L model for product detection. The system is deployed as a robust inference service within a microserviced AWS EKS cluster, heavily optimized for low-latency CPU execution at scale.
Core Engineering Highlights
The Challenge: Running heavy object detection models on GPUs is standard, but cost-prohibitive for large-scale retail deployments.
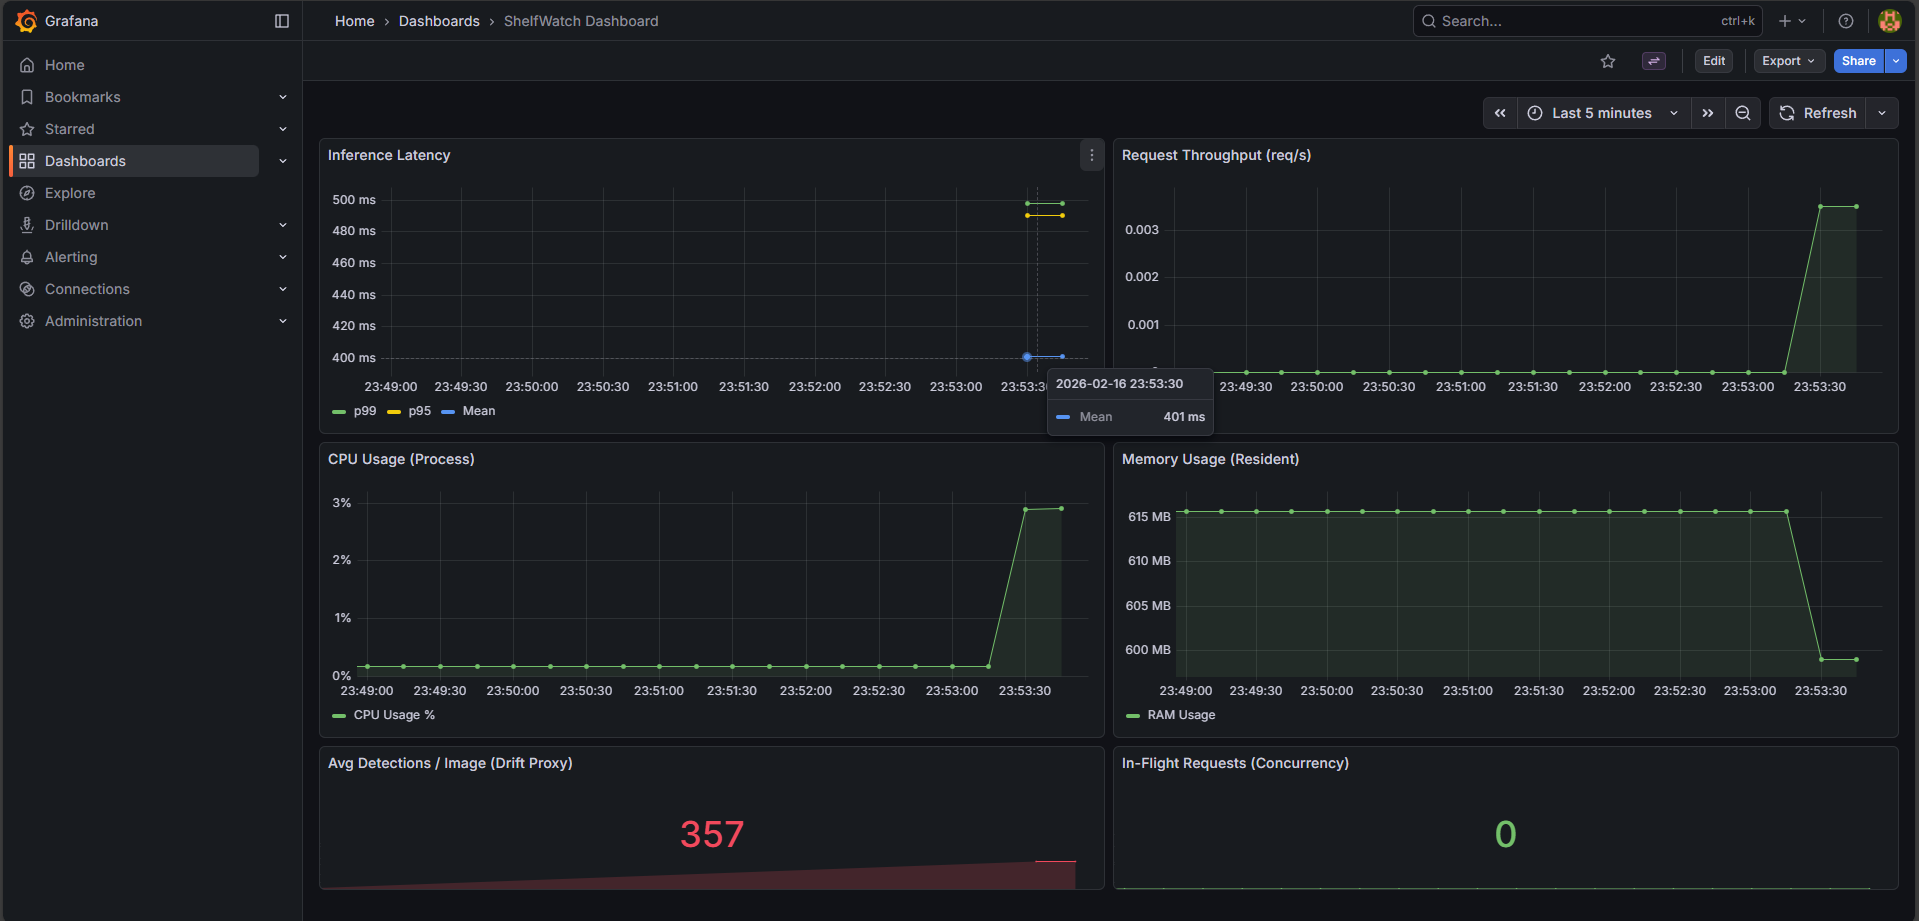
The Implementation: Compiled the YOLO11 model into an in-process ONNX Runtime engine executing INT8 quantized weights. Combined with right-sized CPU resource bin-packing (200m per pod), the system achieves sub-500ms response times entirely on CPU, slicing infrastructure costs by massive margins.
The Challenge: Deploying neural network updates directly to production can cause catastrophic failures if the model degrades.
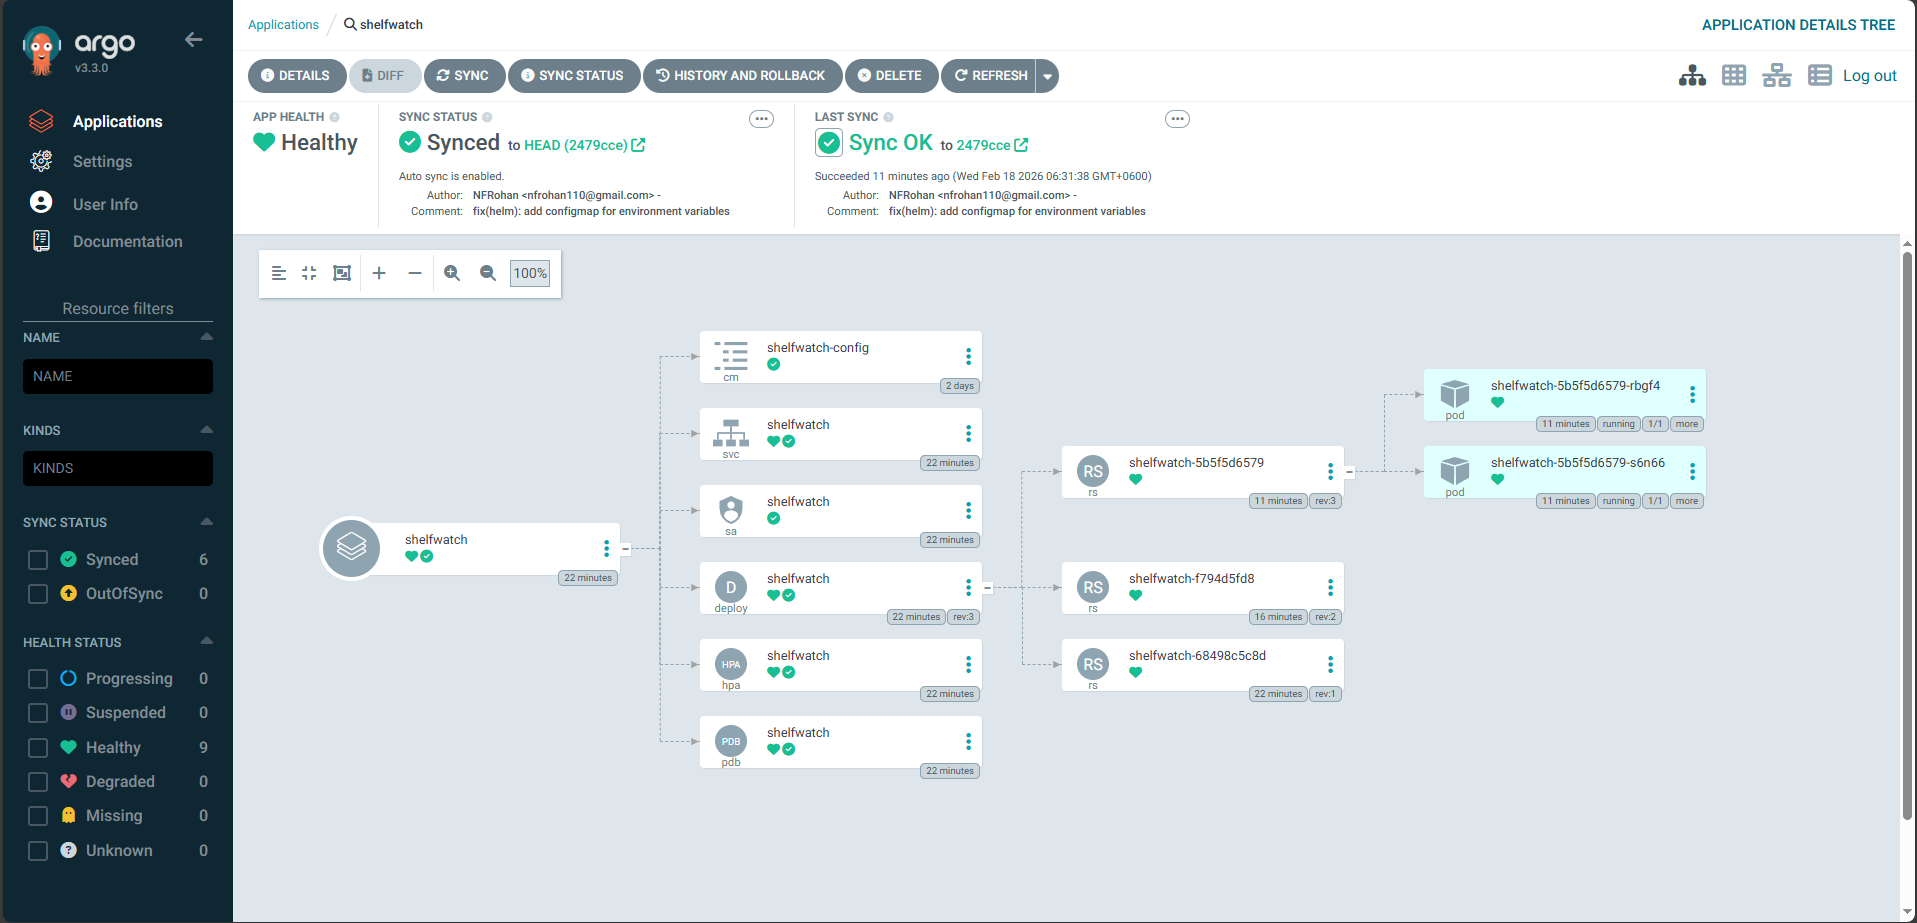
The Implementation: A fully automated GitOps progressive delivery pipeline. An ArgoCD Image Updater securely polls ECR for new tagged builds and triggers Argo Rollouts. These deployments are treated as Canary Rollouts, progressing through weighted traffic splits managed dynamically by the NGINX Ingress Controller, accompanied by automated inference smoke tests before a full promotion.
The Challenge: Securing 70-90% savings via Spot Instances comes with the risk of spontaneous termination events.
The Implementation: Node groups were diversified
across m7i-flex.large, c7i-flex.large, and t3.small
EC2 types to ensure extreme fulfillment predictability. Resilience is enforced via
Pod Disruption Budgets (PDB) and native 2-minute interruption handling,
guaranteeing zero-downtime operation despite volatile hardware lifecycles.
The Security Posture: Container images meant for production retail environments must be tightly secured before touching the ECR boundary.
The Strategy: Zero-trust deployment flows utilizing
short-lived AWS STS credential tokens mapped to GitHub Actions (OIDC). Push triggers are
blocked by hardened quality gates spanning ruff linting, dependency sweeps
using pip-audit, and deep container/OS vulnerability scanning via
Trivy for high/critical CVEs.
Full System Architecture
flowchart TB
    Client(["Store Manager / Client API"])

    subgraph CICD["CI/CD Pipeline"]
        GH["GitHub Repository"] -->|Push to main| Actions["GitHub Actions"]
        Actions -->|"Lint, Test, Scan"| SecurityGate{"Trivy + pip-audit"}
        SecurityGate -->|Pass| Build["Docker Build + Push"]
    end

    subgraph AWS["AWS Cloud"]
        direction TB
        ECR[("Amazon ECR")]

        subgraph EKS["Amazon EKS Cluster"]
            direction TB
            NGINX["NGINX Ingress Controller"]
            HPA[["HPA: 70% CPU, Min 2, Max 3"]]

            subgraph Rollout["Argo Rollout - Canary"]
                Stable["Stable Pods 80-100%"]
                Canary["Canary Pod 0-20%"]
            end

            subgraph SmokeTest["AnalysisRun"]
                Job["Inference Smoke Test"]
            end

            subgraph Observability["Observability"]
                Prometheus[("Prometheus")]
                Grafana["Grafana"]
            end

            NGINX -->|"Weighted Split"| Stable
            NGINX -.->|"Canary Traffic"| Canary
            Job -.->|"Validates"| Canary
            HPA -.->|"Scales"| Rollout
            Prometheus -.->|"Scrapes"| Stable
            Grafana -.->|"Queries"| Prometheus
        end

        subgraph GitOps["GitOps Control Plane"]
            ArgoCD["ArgoCD"]
            ImgUpdater["Image Updater"]
        end

        Build -->|Push Image| ECR
        ImgUpdater -.->|"Polls ECR"| ECR
        ImgUpdater ==>|"Updates Tag"| ArgoCD
        ArgoCD -.->|"Watches Git"| GH
        ArgoCD ==>|"Syncs"| EKS
    end

    Client ==>|"GET /"| NGINX
    Client -.->|"GET /grafana"| NGINX
The routing infrastructure is underpinned by an NGINX Ingress Controller handling Layer 7 traffic routing and canary traffic splitting. Microservices communicate strictly inside the AWS VPC footprint.
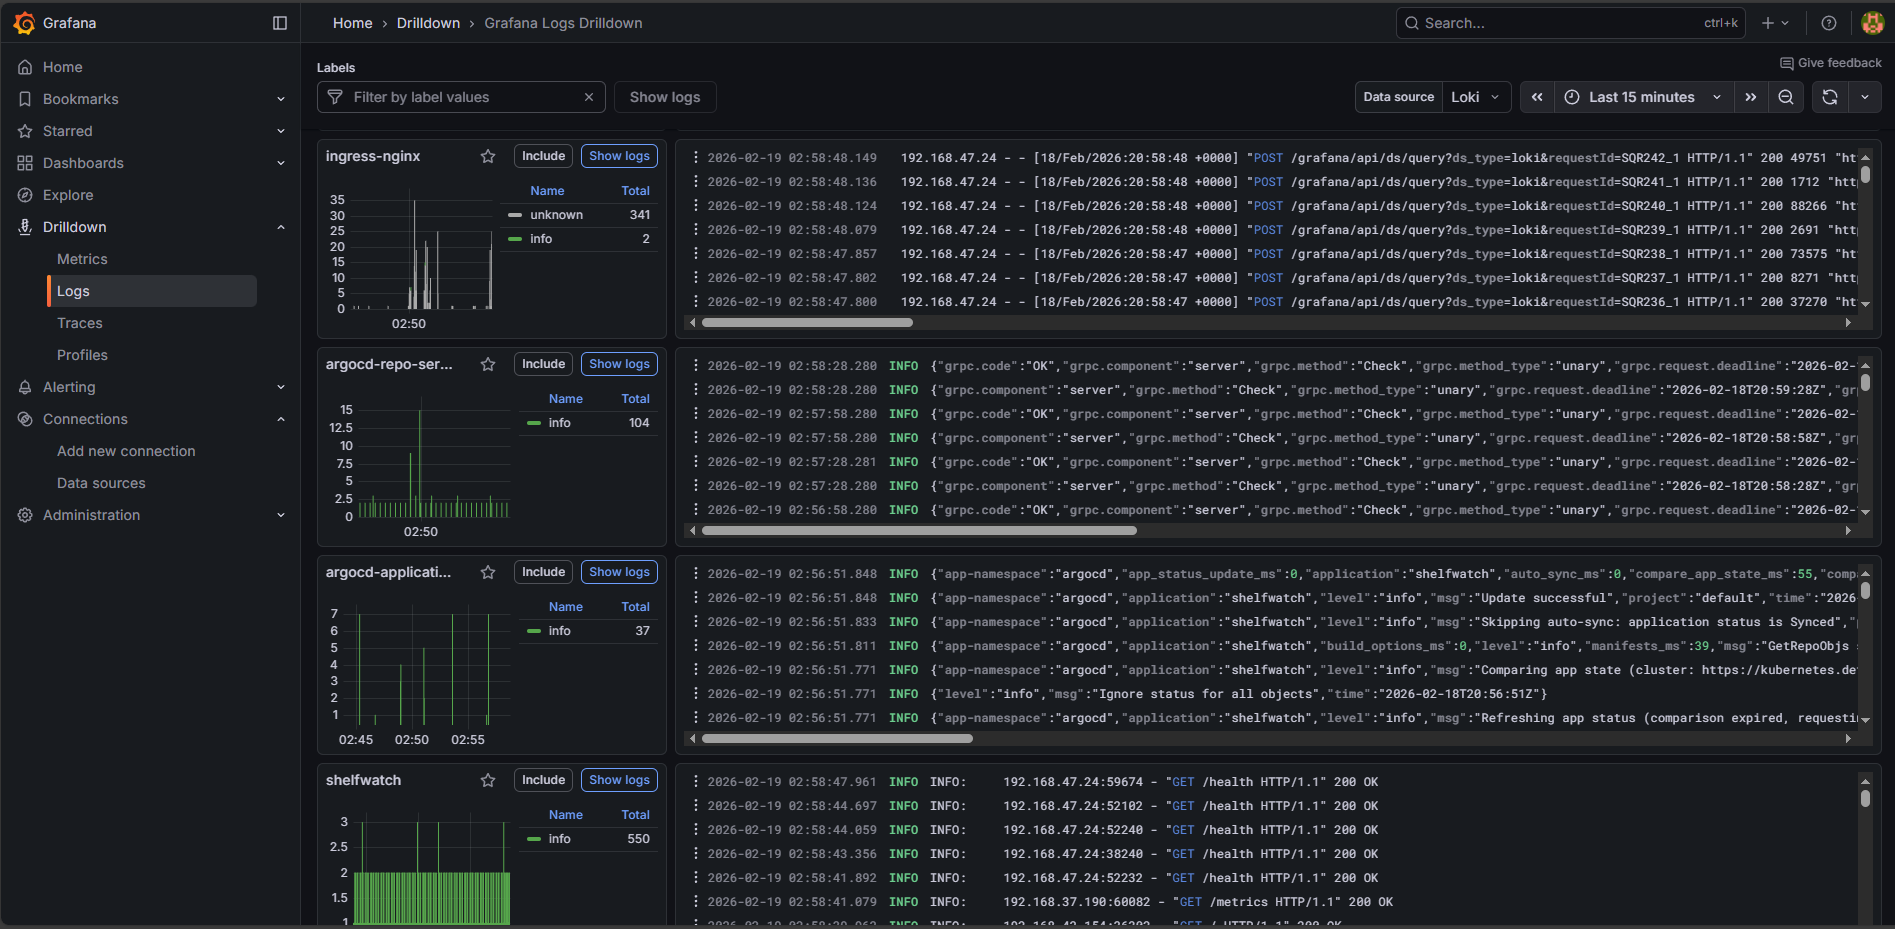
The cluster is constantly supervised by a Prometheus and Grafana LGTM observability suite, pulling application metrics via FastAPI instrumentation and node-level behaviors while logs are aggregated via Loki and Promtail. Deployments map closely to HPA definitions, aggressively scaling the pods based on dynamic metric thresholds.