Overview
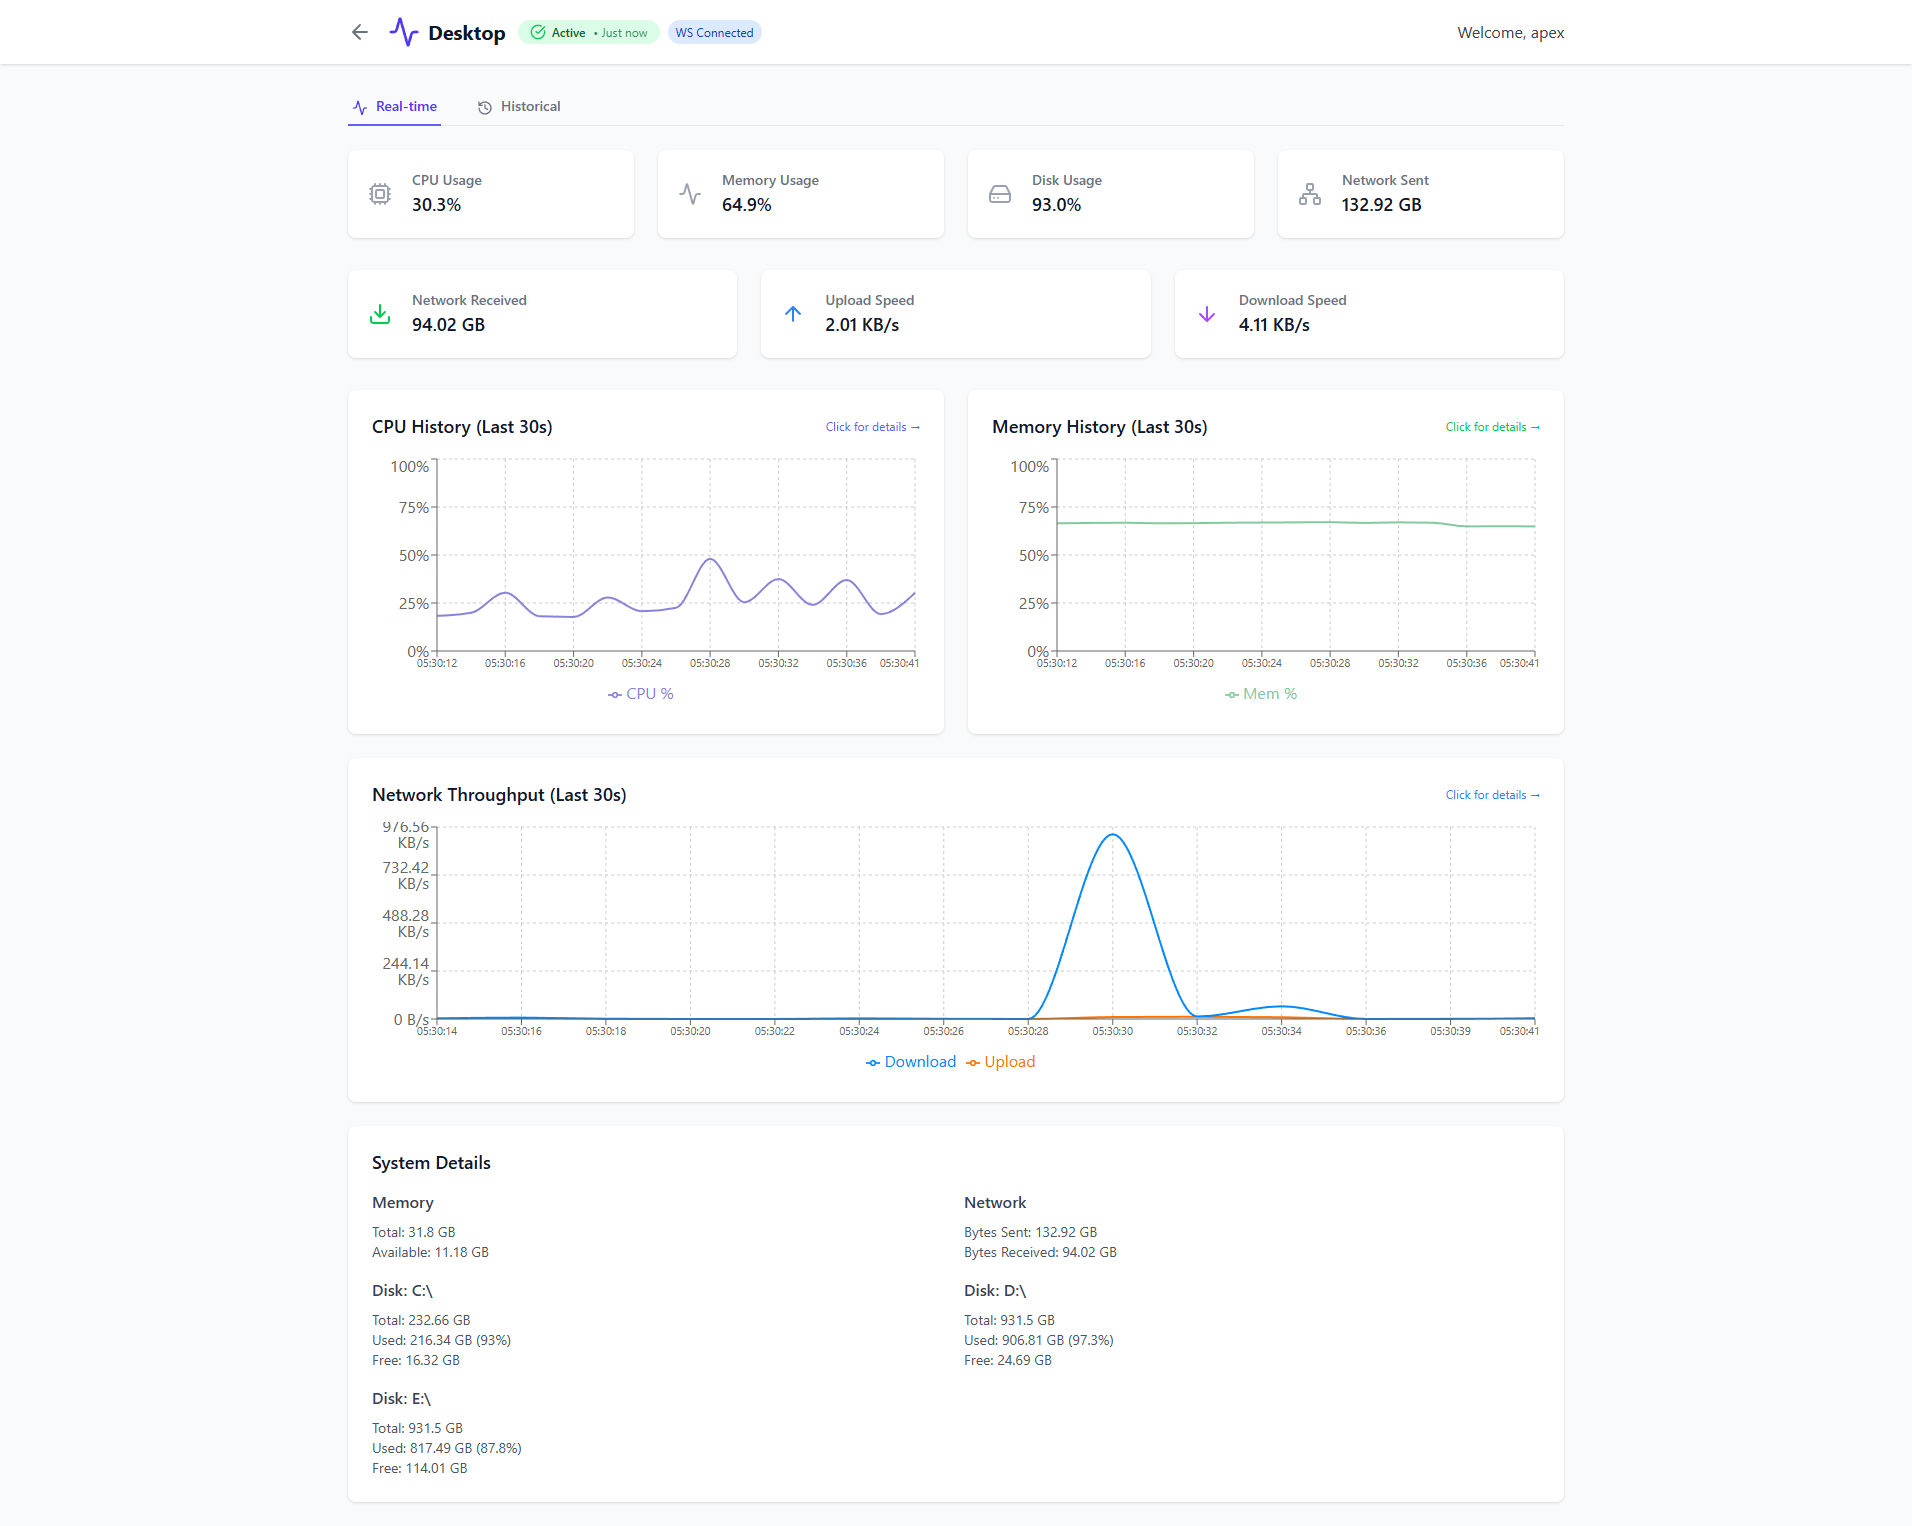
StatusMonitor is a comprehensive system monitoring solution that collects, stores, and visualizes real-time metrics from multiple machines. It features a modern React 19 dashboard with interactive charts, WebSocket-based live updates, and robust historical data analysis powered by Apache Kafka.
By heavily decoupling ingestion layers from persistence schemas, StatusMonitor operates effectively against significant payload loads without bogging down the auth layer or history buckets.
Core Engineering Highlights
The Strategy: A RabbitMQ/Kafka (KRaft) buffer streams durable events directly via default 1-second ticks.
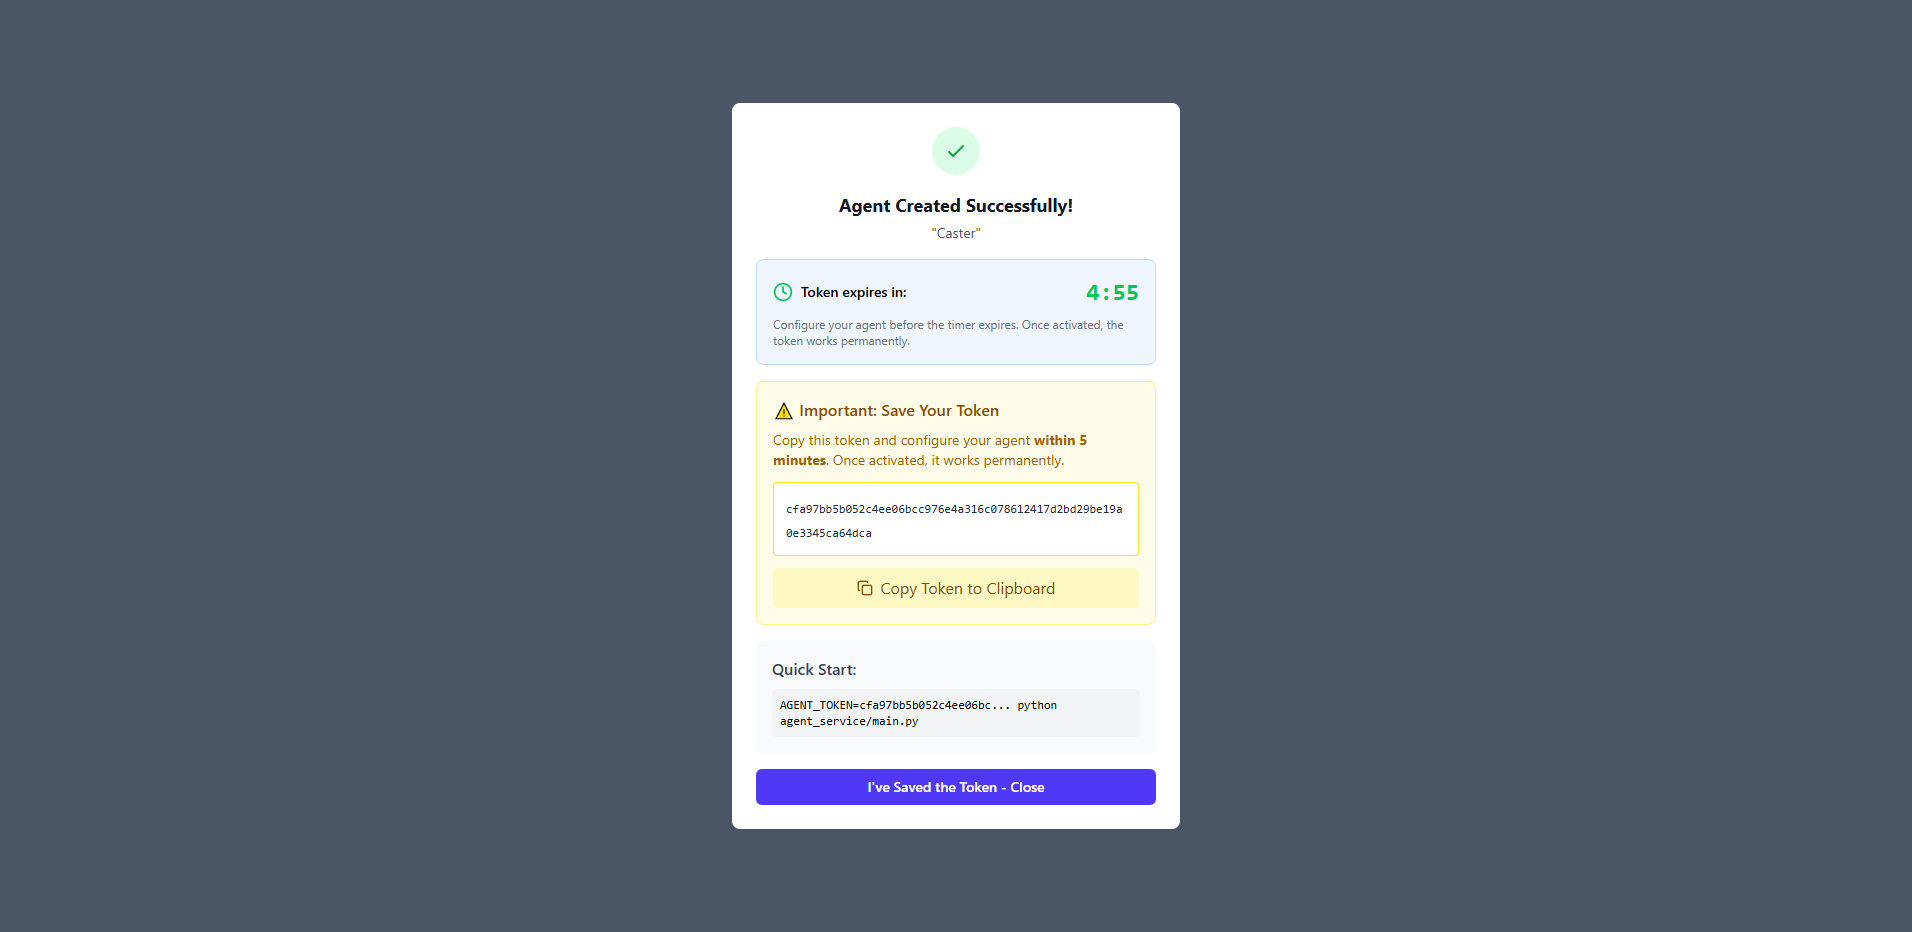
The Implementation: Kafka 4.1.1 sits at the center, isolating the Ingestion Service from the History Service. Token handling across thousands of events per minute isn't routed directly to the database; instead, metrics POSTs hit the Ingestion Edge, validating a JWT payload cached inside Redis (saving ~99% on auth service load), before being published into Kafka. This allows independent scaling of consumers for history storage, WebSocket distribution, and alert rule evaluation.
The Strategy: High-frequency interval data gets cripplingly expensive in Time Series storage mechanisms over longer horizons.
The Implementation: Architected a tiered storage schema inside InfluxDB. Automated Influx tasks compress and migrate raw data sets asynchronously. The first tier holds exact intervals for 24 hours. The second tier squashes 24 hours down to 1-minute aggregates preserved for 7 days. The final tier shrinks to 1-hour resolution persisted for 12 months. The React frontend transparently maps custom boundary ranges (`-5m`, `-7d`) to the dynamically correct metric resolution bucket over the history API layer.
The Strategy: Distributed metric clients must be completely hardened against injection, spoofing, layer-spilling, or denial-of-service attempts.
The Implementation: Implemented multiple protective measures:
- Zero-Trust Authorization: Fail-closed ownership verification blocks access on network hangs rather than passing generic errors. Data is aggressively scoped purely to the authenticated user ID crosscheck.
- Flux Query Sanitization: InfluxDB queries dynamically build raw inputs, presenting severe NoSQL injection vectors. String patterns map cleanly against strictly bound regex validations.
- Algorithmic Resource Limitations: Max time-range limits (clamped 365s periods) explicitly guard memory exhaustion and CPU locking, preventing massive query payload attacks.
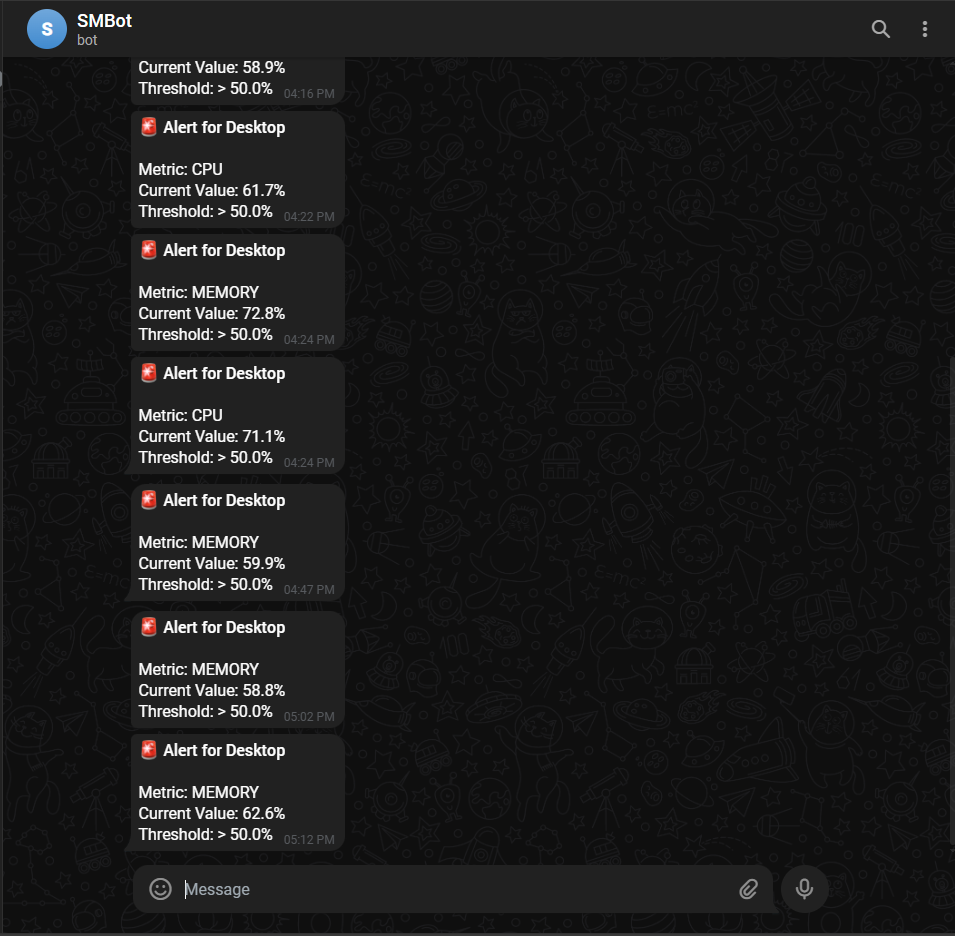
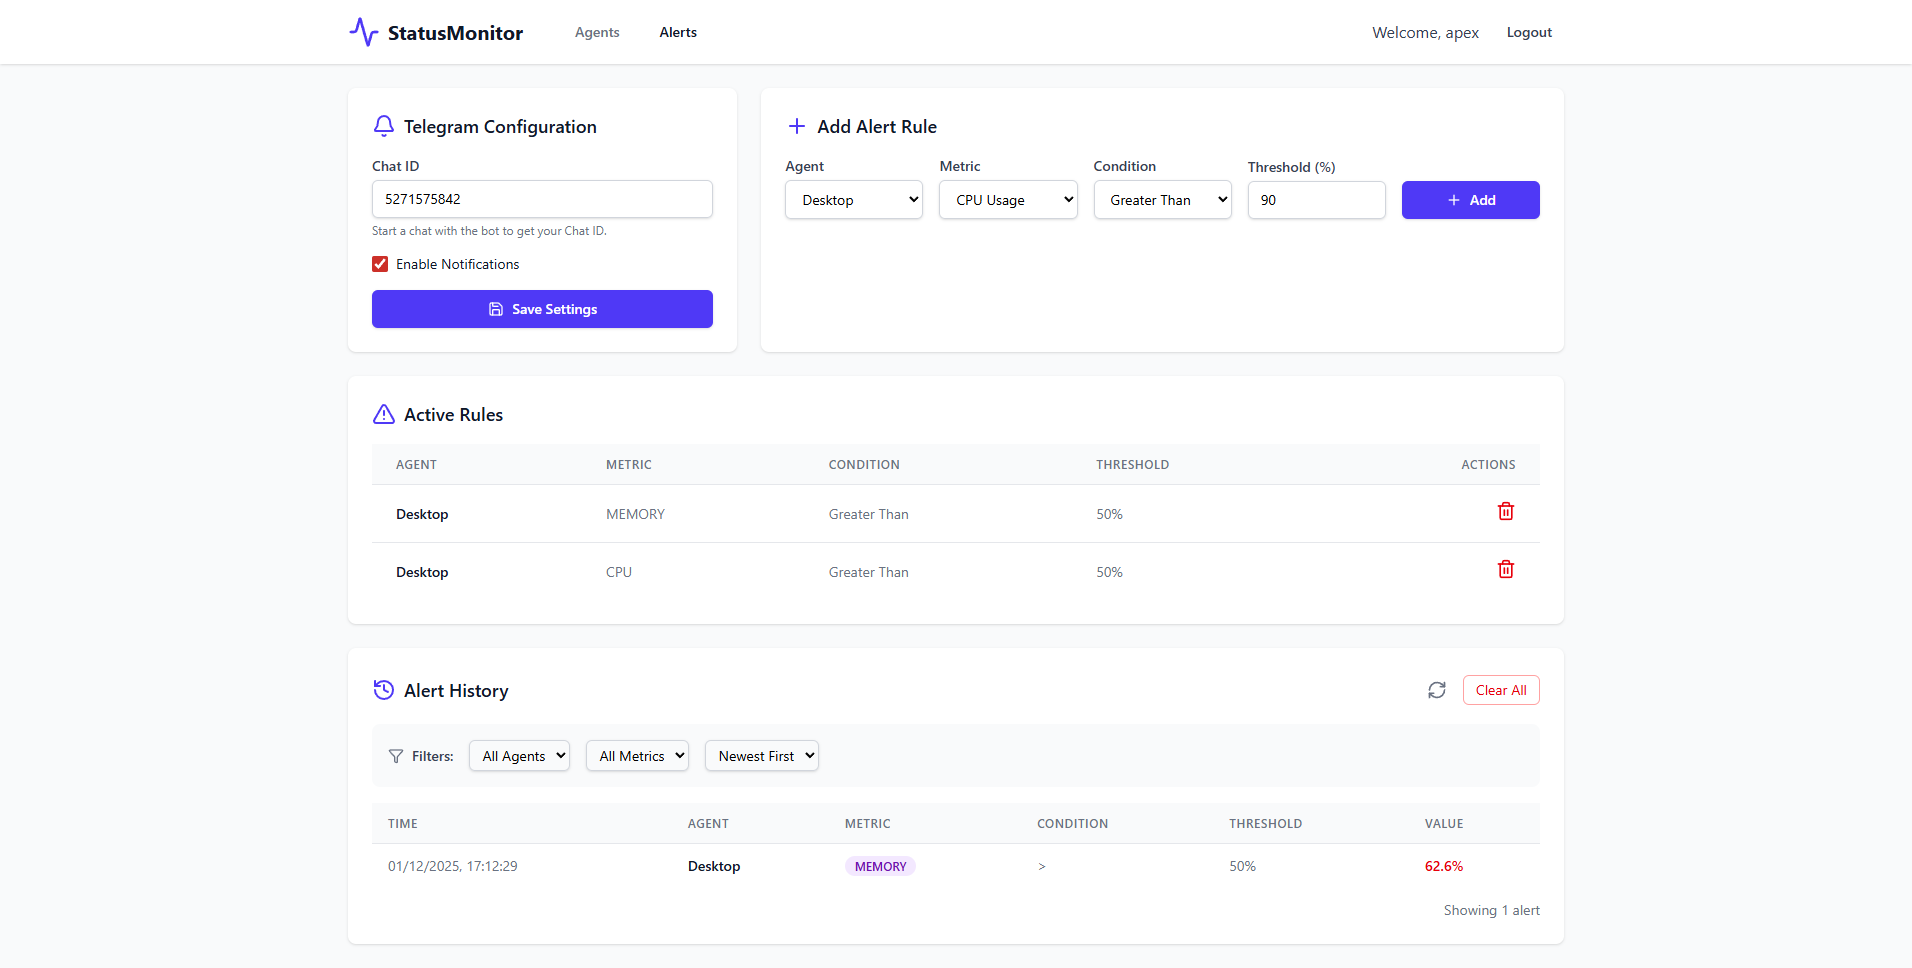
The Strategy: Avoid alert fatigue and spam logic overlapping high-frequency sampling metrics.
The Implementation: A stateless dedicated Python Alert Service listens sequentially on the Kafka consumer loop, processing metrics through Python dictionaries to validate threshold ceilings across CPU, Memory, and Disk triggers. Triggers respect strict 5-minute cooldown epochs held in volatile memory states before flushing payloads to the Telegram Bot API, retaining real-time accuracy within ~1000ms boundaries.